Session 2
Testing a U-Net Network
In this tutorial we will see how to import a pre-trained deep larning model from local storage and use the model for predicting NDVI from Sentinel 1 images of fields which were never exposed to the model.
Input:
- Test files CSV
- Sentinel 1 Images Mentioned in the CSV
- Trained modeel in keras format
- Min max scalling ranges in calculated during the training of the model Outputs:
- Trained Unet Model
- Precited NDVI Images
Steps:
- Assign the variables
- Meta data Filtering(if the image is smaller than 32x32 px)
- Preprocessing and Spatial Gap filling
- Creating the predictions using the model and output comparison
- Comparing the predictions for centre of the field over the time
import os
import warnings
warnings.filterwarnings("ignore")
os.environ['TF_ENABLE_ONEDNN_OPTS'] = '0'
os.environ['TF_CPP_MIN_LOG_LEVEL'] = '2'
os.environ["CUDA_VISIBLE_DEVICES"] = "1"
from glob import glob
from pathlib import Path
from libs.RASTERHELPER import RASTERHELPER as RH
from skimage.transform import resize
from matplotlib import pyplot as plt
import matplotlib.dates as mdates
import matplotlib.colors as mcolors
from matplotlib.lines import Line2D
from matplotlib.patches import Patch
import numpy as np
import rasterio as rio
from libs.DLHELPER import DLHELPER as DH
import tensorflow as tf
tf.config.optimizer.set_jit(False)
from tensorflow.keras import models
# from tensorflow.keras.models import Sequential, save_model
# from tensorflow.keras.layers import ConvLSTM2D, BatchNormalization, Dense, Dropout, TimeDistributed, Conv3D
# from tensorflow.keras.callbacks import EarlyStopping, CSVLogger, ModelCheckpoint, ReduceLROnPlateau
# from tensorflow.keras.losses import MeanSquaredError
# from tensorflow.keras.optimizers import Adam
# from tensorflow.keras.metrics import RootMeanSquaredError

from datetime import datetime
import re, pandas, random, shutil
RH=RH()
DH = DH()

DIR_MODEL_SAVE = './../Models_S1S2/'
MODEL_NAME = 'Unet_Model_2025-08-12_14-10.keras'
MODEL_HISTNAME = 'Unet_TrainingLog_2025-08-12_14-10.csv'
DIR_PLOTS = "./Plots_S1S2"

STRIDE =8
N_EPOCH = 200
N_INPUTBANDS = 2
TARGET_SHAPE = (128, 128)
TARGET_SHAPE_X = (N_INPUTBANDS, 128, 128)
TARGET_SHAPE_Y = (128, 128)
TRAINING_BATCH_SIZE = 16

SEED = 50
MIN_R_H, MIN_R_W = 32, 32
PREDICTOR_NAMES = ["VV", "VH"]
PREDICTING_NAME = "NDVI"

min_vals = [-49.042988, -89.03331, 7.8717454e-07, 0.002476306]
max_vals = [43.408474, 20.598831, 7.9789853, 811394.9]

TRAIN_PATH = './../Data/AllCropS1S2_train_test/global_balanced_train.csv'
VAL_PATH = './../Data/AllCropS1S2_train_test/global_balanced_validation.csv'
TEST_PATH = './../Data/AllCropS1S2_train_test/global_balanced_test.csv'
Data Loading, Preprocessing, and Feature Engineering
print(f"\n\n{'='*40}\nLoading and Filtering Datasets\n{'='*40}")
TrainFilesDF = pandas.read_csv(TRAIN_PATH).sample(frac=1).reset_index(drop=True)
ValidationFilesDF = pandas.read_csv(VAL_PATH).sample(frac=1).reset_index(drop=True)
TestFilesDF = pandas.read_csv(TEST_PATH).sample(frac=1).reset_index(drop=True)
print(f'\tTrain: {TrainFilesDF.shape}, Val: {ValidationFilesDF.shape}, Test: {TestFilesDF.shape}')
TrainFilesDF['DATASET'] = 'TRAIN'
ValidationFilesDF['DATASET'] = 'VAL'
TestFilesDF['DATASET'] = 'TEST'
AllFilesDF = pandas.concat([TrainFilesDF, ValidationFilesDF, TestFilesDF], ignore_index=True)
AllFilesDF[AllFilesDF['DATASET']=='TEST']

top_fieldnum =  AllFilesDF['FIELDNUM'].value_counts().idxmax()
print('\tSelected Field Number:', top_fieldnum)
AllFilesDF = AllFilesDF[AllFilesDF['FIELDNUM']==top_fieldnum]
print(f"\tFilter out erroneous images")
print("\tFiltering All Data...")
AllFilesDF = AllFilesDF.copy()
results_all = AllFilesDF.apply(RH.check_row_for_errors, axis=1, predictor_bands=PREDICTOR_NAMES, predicting_name=PREDICTING_NAME, nan_threshold=1, min_r_h=MIN_R_H, min_r_w=MIN_R_W, verbose=False)
AllFilesDF[['IS_VALID', 'ERROR_MESSAGE', 'META_INFO']] = pandas.DataFrame(results_all.tolist(), index=AllFilesDF.index)
updated_all_df = AllFilesDF[AllFilesDF['IS_VALID']].reset_index(drop=True)
all_error_files = AllFilesDF[~AllFilesDF['IS_VALID']]
print(f"\tFiltering All Done, Removed {len(all_error_files)} rows, Current Shape: {updated_all_df.shape}")

print(f"\n\n{'='*40}\nLoad the images, and Feature Engineering\n{'='*40}")
bands_all_predictor, bands_all_predicting, all_processing_error = RH.processFiles(dataframe=updated_all_df, predictor_names=PREDICTOR_NAMES, predicting_name=PREDICTING_NAME, filling_ksize = 1, plot_filling_comp = False, verbose = True)
print(f"\tFilling all Done, Errors: {len(all_processing_error)}")
updated_all_df = RH.remove_error_indices(updated_all_df, all_processing_error)
print(f"\tCleaned All size: {updated_all_df.shape}")
print(f"\tAdding RVI and BCR band")
bands_all_predictor = RH.feature_generation_rvi_bcr(bands_all_predictor)
print(f"\tNormalizing Bands with provided min max ranges")
bands_all_predictor, min_vals, max_vals = RH.normalize_bands_minmax(bands_all_predictor, min_vals=min_vals, max_vals=max_vals)
print(f'\tAdding DOY band')
bands_all_predictor = RH.addDoyBand(bands_all_predictor, updated_all_df)
print(f"\tExample normalized All image shape: {bands_all_predictor[0].shape}")
RH.plot_distributions(updated_all_df, df_title = f'All(Total: {updated_all_df.shape}', plot_save_dir=None)

print(f"\n\n{'='*40}\nPatching the images\n{'='*40}")
all_x_all_patches, all_y_all_patches = [], []
all_image_original_shapes = [] # Not used in this specific comparison, but good to keep
patch_size = TARGET_SHAPE
for i, image_x in enumerate(bands_all_predictor):
    image_y = bands_all_predicting[i]
    original_unpadded_shape_x = image_x.shape
    original_unpadded_shape_y = image_y.shape
    x_patches_with_coords = RH.extract_patches_overlapping(image_array = image_x, patch_size = patch_size, stride = (TARGET_SHAPE[0]-STRIDE, TARGET_SHAPE[0]-STRIDE),  pad_mode = 'symmetric') # or reflect
    y_patches_with_coords = RH.extract_patches_overlapping(image_array = image_y, patch_size = patch_size, stride = (TARGET_SHAPE[0]-STRIDE, TARGET_SHAPE[0]-STRIDE),  pad_mode = 'symmetric')
    if len(x_patches_with_coords) != len(y_patches_with_coords):
        print(f"Warning: Mismatch in number of patches for image {i}. Skipping.")
        continue
    for (x_patch, x_coords), (y_patch, y_coords) in zip(x_patches_with_coords, y_patches_with_coords):
        all_x_all_patches.append(x_patch)
        all_y_all_patches.append(y_patch)
    if x_patches_with_coords:
        last_x_coord = x_patches_with_coords[-1][1][1]
        last_y_coord = x_patches_with_coords[-1][1][0]
        padded_H = last_y_coord + patch_size[0]
        padded_W = last_x_coord + patch_size[1]
        num_channels_x = x_patches_with_coords[0][0].shape[0]
        num_channels_y = y_patches_with_coords[0][0].shape[0]
        all_image_original_shapes.append({'x_padded_shape': (num_channels_x, padded_H, padded_W),'x_unpadded_shape': original_unpadded_shape_x,'y_padded_shape': (num_channels_y, padded_H, padded_W),'y_unpadded_shape': original_unpadded_shape_y})
X_all_patches = np.array(all_x_all_patches)
Y_all_patches = np.array(all_y_all_patches)
# Transpose for Keras model input (N, H, W, C)
X_all_model_input = np.transpose(X_all_patches, (0, 2, 3, 1))
Y_all_model_input = np.transpose(Y_all_patches, (0, 2, 3, 1))
print(f'\tShapes AllX: {X_all_model_input.shape}, AllY: {Y_all_model_input.shape}')
========================================
Loading and Filtering Datasets
========================================
Train: (17, 18), Val: (9, 18), Test: (14, 18)
Selected Field Number: 67345
Filter out erroneous images
Filtering All Data...
Filtering All Done, Removed 0 rows, Current Shape: (6, 22)
========================================
Load the images, and Feature Engineering
========================================
Filling all Done, Errors: 0
Cleaned All size: (6, 22)
Adding RVI and BCR band
Normalizing Bands with provided min max ranges
Adding DOY band
Example normalized All image shape: (5, 177, 160)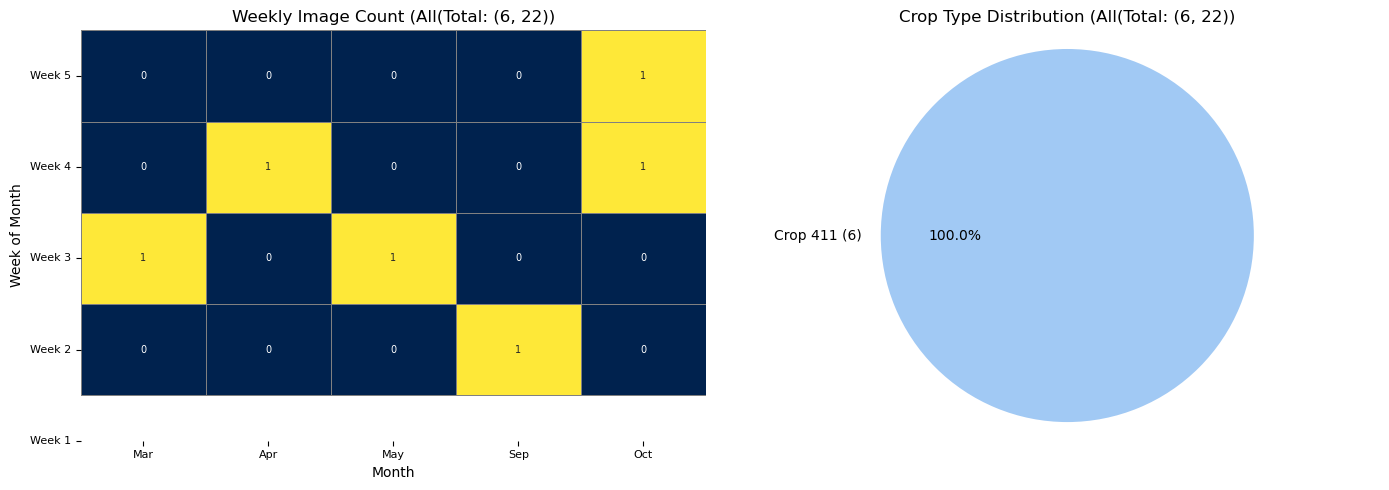
========================================
Patching the images
========================================
    Shapes AllX: (24, 128, 128, 5), AllY: (24, 128, 128, 1)
Loading Pretrained Model, and Verify the predictions over the time
print(f"\n\n{'='*40}\nLoading pre trained model\n{'='*40}")
model_file = f'{DIR_MODEL_SAVE}{MODEL_NAME}'
model = models.load_model(model_file)
print(f"\tModel loaded from {model_file}")

# --- Prediction on selected Patches ---
print(f"\n\n{'='*40}\nPredictions with pretrained model\n{'='*40}")
print("\tMaking predictions on selected patches...")
predicted_all_patches_model_output = model.predict(X_all_model_input) # Shape (num_patches, H, W, 1)
print(f"\tShape of predicted_all_patches_model_output: {predicted_all_patches_model_output.shape}")

predicted_all_patches_for_reconstruction = np.transpose(predicted_all_patches_model_output, (0, 3, 1, 2))
print(f"\tShape of predicted_all_patches_for_reconstruction: {predicted_all_patches_for_reconstruction.shape}")

# --- Reconstruction of Full Images ---
print("\tReconstructing full predicted and actual images...")
reconstructed_predicted_images, reconstructed_actual_images, reconstructed_vv_images, reconstructed_vh_images  = [],[],[],[],

# Get total number of patches per original image to correctly reconstruct
patch_count_per_image = []
current_patch_idx = 0
rand_index = random.choice(updated_all_df.index)

# Re-extracting patches with coords for each original full image (X and Y), This allows us to map predicted patches back to their original image context for reconstruction
original_all_image_x_patches_with_coords_list = []
original_all_image_y_patches_with_coords_list = []

for i, full_x_image in enumerate(bands_all_predictor):
    full_y_image = bands_all_predicting[i]
    x_patches_of_this_image = RH.extract_patches_overlapping(image_array = full_x_image, patch_size = patch_size, stride = (TARGET_SHAPE[0]-STRIDE, TARGET_SHAPE[0]-STRIDE),  pad_mode = 'symmetric')
    y_patches_of_this_image = RH.extract_patches_overlapping(image_array = full_y_image, patch_size = patch_size,stride = (TARGET_SHAPE[0]-STRIDE, TARGET_SHAPE[0]-STRIDE),  pad_mode = 'symmetric')
    original_all_image_x_patches_with_coords_list.append(x_patches_of_this_image)
    original_all_image_y_patches_with_coords_list.append(y_patches_of_this_image)

current_global_patch_idx = 0
for img_idx, shape_info in enumerate(all_image_original_shapes):
    # Get the original full image and label for reference (VV/VH bands)
    original_full_x_image = bands_all_predictor[img_idx]
    original_full_y_image = bands_all_predicting[img_idx] # This is your original label mask
    num_patches_in_this_image = len(original_all_image_x_patches_with_coords_list[img_idx])
    predicted_patches_for_this_image_raw = predicted_all_patches_for_reconstruction[current_global_patch_idx : current_global_patch_idx + num_patches_in_this_image]

    # Create (patch_data, (y,x)) tuples for reconstruction function
    predicted_patches_with_coords_for_reconstruction = []
    for j in range(num_patches_in_this_image):
        original_coords = original_all_image_x_patches_with_coords_list[img_idx][j][1]
        predicted_patch_data = predicted_patches_for_this_image_raw[j]
        predicted_patches_with_coords_for_reconstruction.append((predicted_patch_data, original_coords))

    # Reconstruct the predicted NDVI image
    reconstructed_pred_ndvi = RH.reconstruct_overlapping(predicted_patches_with_coords = predicted_patches_with_coords_for_reconstruction, original_padded_shape=shape_info['y_padded_shape'], original_unpadded_shape=shape_info['y_unpadded_shape'], patch_size = TARGET_SHAPE)
    reconstructed_predicted_images.append(reconstructed_pred_ndvi.squeeze(axis=0)) # Squeeze channel for 2D
    reconstructed_actual_images.append(original_full_y_image) # This assumes original_full_y_image is (H,W)
    reconstructed_vv_images.append(original_full_x_image[0, :, :]) # Assuming VV is band 0
    reconstructed_vh_images.append(original_full_x_image[1, :, :]) # Assuming VH is band 1

    current_global_patch_idx += num_patches_in_this_image

print(f"\tNumber of reconstructed predicted images: {len(reconstructed_predicted_images)}, Actual Images: {len(reconstructed_actual_images)}")
print(f"\tShape of {rand_index}th reconstructed shape predicted image: {reconstructed_predicted_images[rand_index].shape} actual:  {reconstructed_actual_images[rand_index].shape}")

all_dates = updated_all_df['DATE'].dt.strftime('%Y-%m-%d')
all_field_nums = updated_all_df['FIELDNUM'].astype(str)
all_crop_types = updated_all_df['CROPTYPE'].astype(str)
all_crop_groups = updated_all_df['CROPGROUP'].astype(str)
all_dataset_type = updated_all_df['DATASET'].astype(str)

# Filter val_labels to match the number of reconstructed images (which should be the number of original images)
all_labels_for_reconstructed_images = ("Field_" + all_field_nums + "_" + all_crop_groups + "_"  + all_crop_types + "_" + all_dates  + " " + all_dataset_type).tolist()

DIR_PLOTS = f'./Plots_Reconstructed_Comparison_All_Unet_Model' # New directory for reconstructed plots
os.makedirs(DIR_PLOTS, exist_ok=True)
c_reconstructed =  1#len(reconstructed_predicted_images) # Compare all reconstructed images
print(f"\tCalling comparison function for {c_reconstructed} reconstructed images...")
RH.compareNDVIs_with_VV_VH(actual_ndvis = reconstructed_actual_images[:c_reconstructed], predicted_ndvis = reconstructed_predicted_images[:c_reconstructed], actual_vv = reconstructed_vv_images[:c_reconstructed], actual_vh = reconstructed_vh_images[:c_reconstructed], dates = all_labels_for_reconstructed_images[:c_reconstructed], export_path = DIR_PLOTS, export_plot = False) # Set to True to save plots
print(f"\tComparison of reconstructed images complete. Check '{DIR_PLOTS}' for plots.")
========================================
Loading pre trained model
========================================
Model loaded from ./../Models_S1S2/Unet_Model_2025-08-12_14-10.keras
========================================
Predictions with pretrained model
========================================
Making predictions on selected patches...
1/1 ━━━━━━━━━━━━━━━━━━━━ 6s 6s/step
Shape of predicted_all_patches_model_output: (24, 128, 128, 1)
Shape of predicted_all_patches_for_reconstruction: (24, 1, 128, 128)
Reconstructing full predicted and actual images...
Number of reconstructed predicted images: 6, Actual Images: 6
Shape of 0th reconstructed shape predicted image: (177, 160) actual: (1, 177, 160)
Calling comparison function for 1 reconstructed images...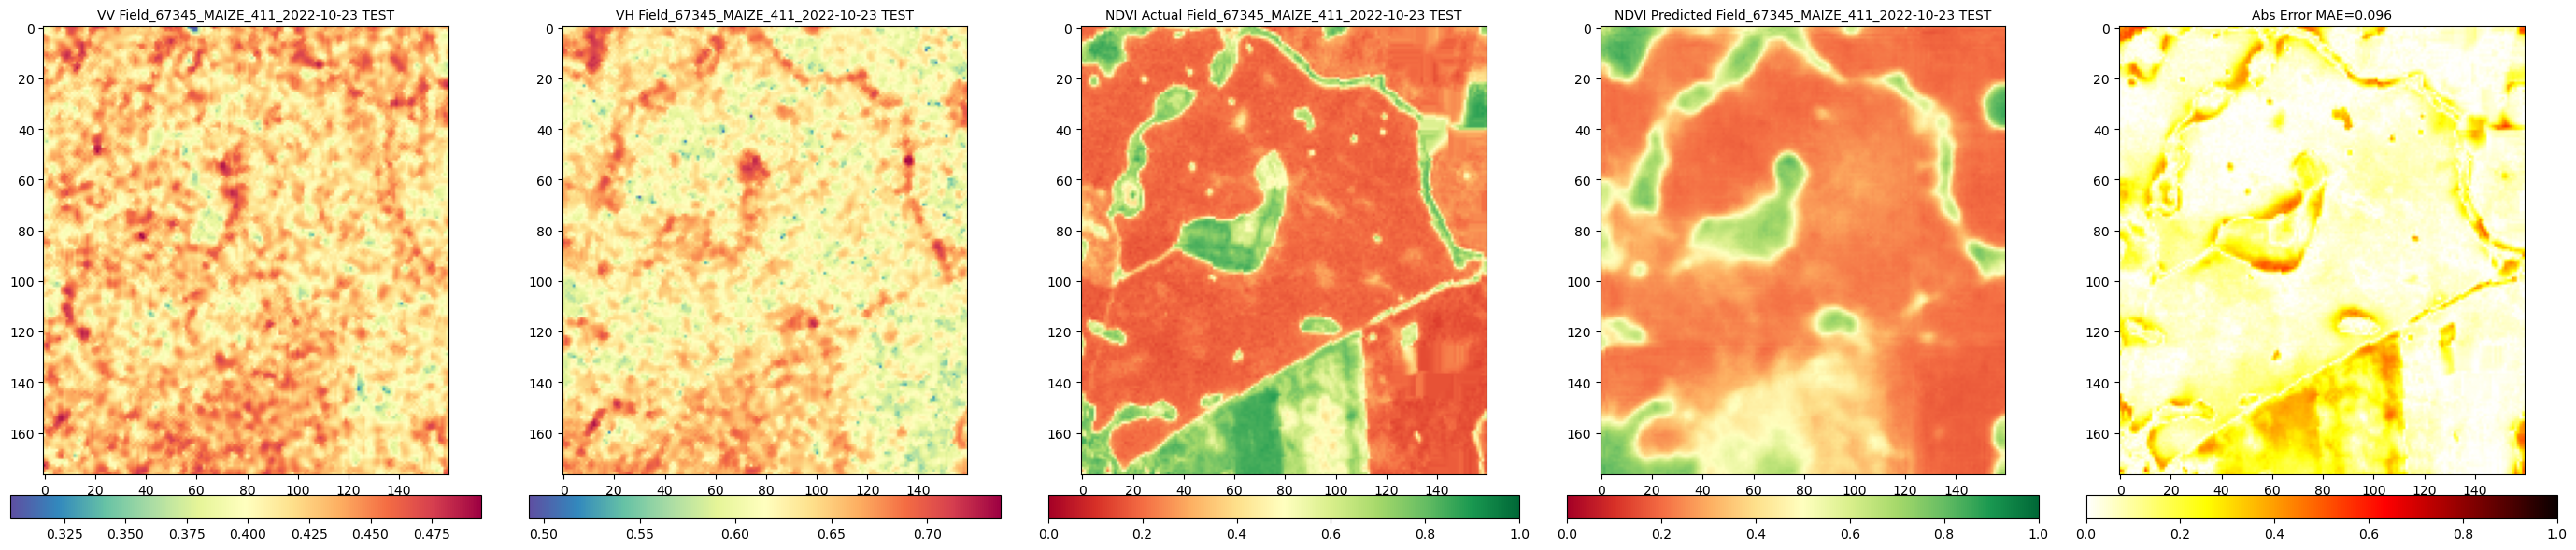
Comparison of reconstructed images complete. Check './Plots_Reconstructed_Comparison_All_Unet_Model' for plots.Looking at the predictions
In this part we pick the centre pixel of a field and look at the ground trouth and predicted NDVI on that field over the years to understand the model performance. For demonstartion we take the field which has the highest number images in our AllFilesDF. To check differnt field please change the value of top_fieldnum to the FIELDNUM of your desire.
top_fieldnum = updated_all_df['FIELDNUM'].value_counts().idxmax()
print(f"\n\n{'='*40}\nPredictions for filed no {top_fieldnum} over the time\n{'='*40}")
print('\tSelected Field Number:', top_fieldnum)
field_df = updated_all_df[updated_all_df['FIELDNUM'] == top_fieldnum].copy()#.reset_index(drop=True)
field_preds, field_actuals, field_dates, field_datasets, field_paths_s1, field_paths_s2, field_vhs, field_vvs, field_ctypes = [], [], [], [], [], [], [], [], []
field_indices = field_df.index.tolist()
for idx in field_indices:
# Squeeze the arrays to ensure they are 2D before proceeding
t_predicted = np.squeeze(reconstructed_predicted_images[idx])
t_actual = np.squeeze(reconstructed_actual_images[idx])
t_vv = np.squeeze(reconstructed_vv_images[idx])
t_vh = np.squeeze(reconstructed_vh_images[idx])
t_file = updated_all_df.loc[idx] # Get the corresponding row from the main dataframe
t_path_s1 = t_file["FILEPATH_S1"]
t_path_s2 = t_file["FILEPATH_S2"]
t_date = t_file["DATE"]
t_dataset = t_file["DATASET"].upper()
t_ctype = f'{t_file["CROPGROUP"]}_{t_file["CROPTYPE"]}'
t_h, t_w = t_actual.shape
t_centre_x, t_centre_y = t_w // 2, t_h // 2
field_preds.append(t_predicted[t_centre_y, t_centre_x])
field_actuals.append(t_actual[t_centre_y, t_centre_x])
field_vhs.append(t_vh[t_centre_y, t_centre_x])
field_vvs.append(t_vv[t_centre_y, t_centre_x])
field_dates.append(t_date)
field_datasets.append(t_dataset)
field_paths_s1.append(t_path_s1)
field_paths_s2.append(t_path_s2)
field_ctypes.append(t_ctype)
field_data = pandas.DataFrame({ "path_s1": field_paths_s1, "path_s2": field_paths_s2, "date": field_dates, 'crop_type': field_ctypes, "vv": field_vvs, "vh": field_vhs, "pred": field_preds,"actual": field_actuals,"dataset": field_datasets,})
field_data = field_data.sort_values("date").reset_index(drop=True)
print(f'\tDataframe Created')
field_data["date"] = pandas.to_datetime(field_data["date"])
field_data = field_data.sort_values("date")
field_data['error'] = abs(field_data['pred'] - field_data['actual'])
test_data = field_data[field_data['dataset'] == 'TEST'].copy()
error_stats = test_data.groupby('dataset')['error'].agg(['min', 'max', 'mean']).reset_index()
plt.figure(figsize=(15, 6))
dataset_markers = {'TEST': 'o'}
for dataset_name, marker_style in dataset_markers.items():
dataset_df = field_data[field_data['dataset'] == dataset_name]
if not dataset_df.empty:
plt.scatter(dataset_df["date"], dataset_df["pred"], label=f"Predicted ({dataset_name})", marker=marker_style, color='green', s=30, alpha=0.3)
plt.scatter(dataset_df["date"], dataset_df["actual"], label=f"Actual ({dataset_name})", marker=marker_style, color='red', s=15, alpha=0.7)
legend_elements = []
for dataset_name, marker_style in dataset_markers.items():
predicted_handle = Line2D([0], [0], marker=marker_style, color='w', markerfacecolor='green', markersize=10, label=f'Predicted ({dataset_name})')
actual_handle = Line2D([0], [0], marker=marker_style, color='w', markerfacecolor='red', markersize=10, label=f'Actual ({dataset_name})')
legend_elements.extend([predicted_handle, actual_handle])
# Add the statistical labels using Patch objects
for index, row in error_stats.iterrows():
label = f"{row['dataset']} Errors: \nMin={row['min']:.2f} \nMax={row['max']:.2f} \nMean={row['mean']:.2f}"
legend_elements.append(Patch(facecolor='none', edgecolor='none', label=label))
plt.xlabel("Date")
plt.ylabel("Value")
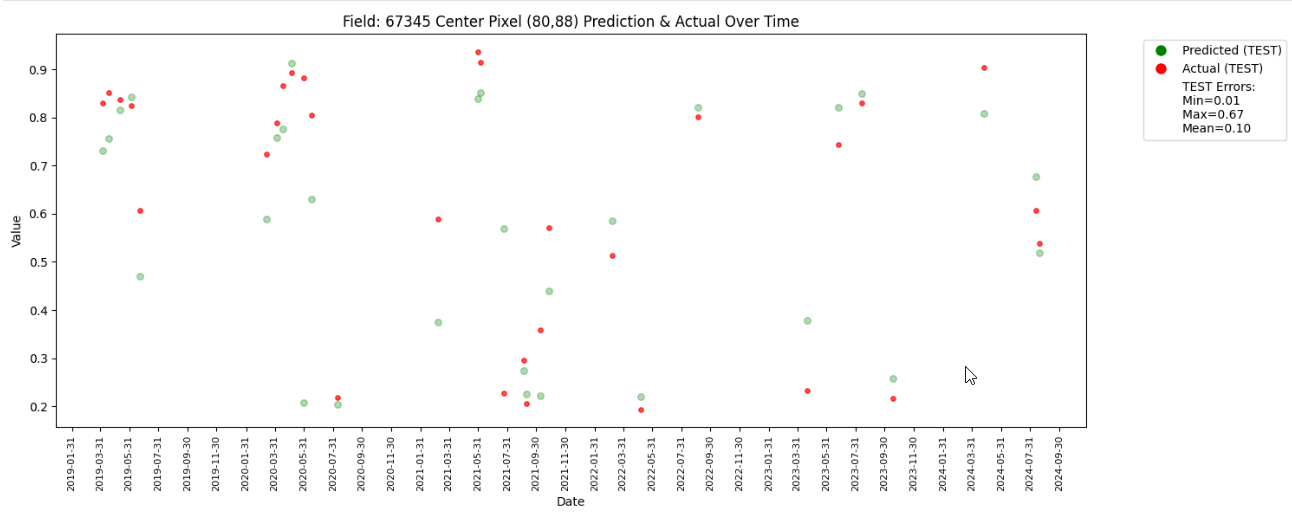
plt.title(f"Field: {top_fieldnum} Center Pixel ({t_centre_x},{t_centre_y}) Prediction & Actual Over Time")
plt.legend(handles=legend_elements, bbox_to_anchor=(1.05, 1), loc='upper left')
ax = plt.gca()
ax.xaxis.set_major_locator(mdates.MonthLocator(interval=1))
ax.xaxis.set_major_formatter(mdates.DateFormatter('%Y-%m-%d'))
plt.xticks(rotation=90, fontsize=8)
plt.tight_layout()
plt.show()========================================
Predictions for filed no 67345 over the time
========================================
Selected Field Number: 67345
Dataframe Created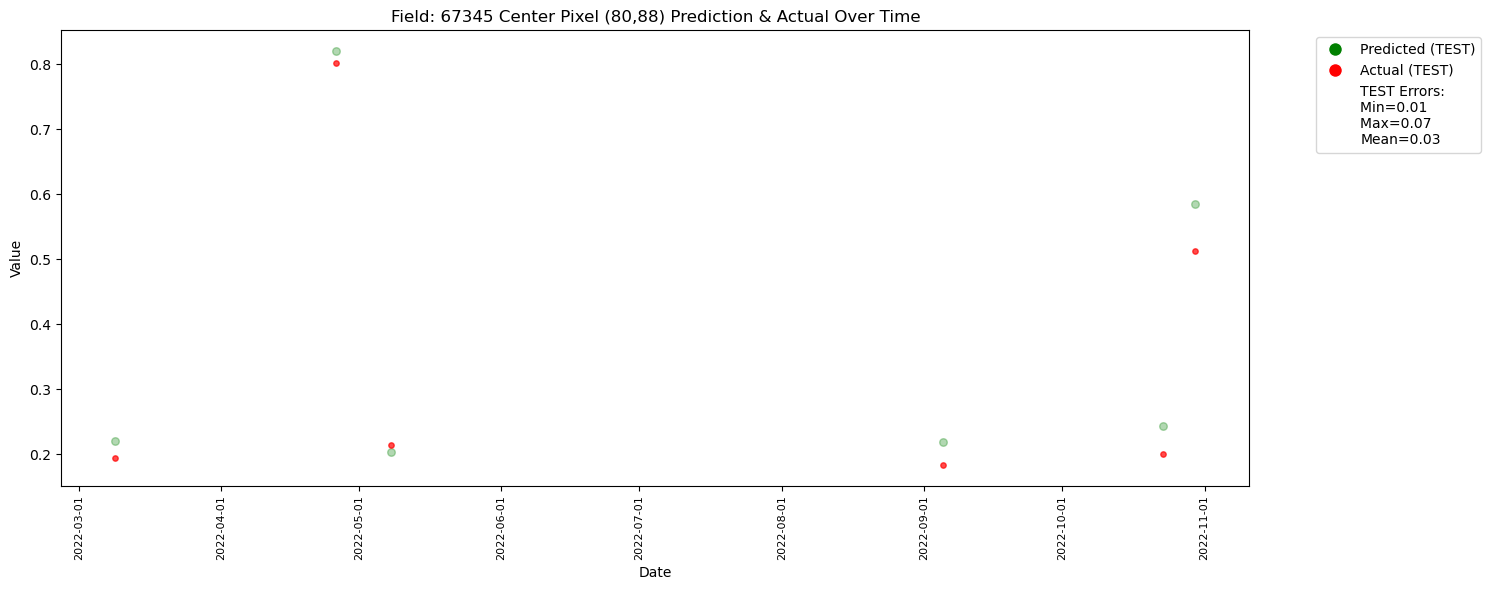
The plot has less number of points due to redued data size. With larger number of data it would look like the one below.