Session 3
Generating denser timeseries by fusing groundtruth and synthetic NDVI data
In this tutorial we will see how to import a pre-trained deep larning model from local storage and use the model for predicting NDVI from Sentinel 1 images of fields which were never exposed to the model.
Input:
- Sentinel 1 Images
- Trained modeel in keras format
- Min max scalling ranges in calculated during the training of the model Outputs:
- Trained Unet Model
- Precited NDVI Images
- Denser time series plot
Steps:
- Preprocessing and Spatial Gap filling
- Creating the predictions using the model and output comparison
- Comparing the predictions for centre of the field over the time
- Producing denser time series plot for representative fields
import os
os.environ['TF_ENABLE_ONEDNN_OPTS'] = '0'
os.environ['TF_CPP_MIN_LOG_LEVEL'] = '2'
os.environ["CUDA_VISIBLE_DEVICES"] = "1"
import warnings
warnings.filterwarnings("ignore")
from glob import glob
from pathlib import Path
from matplotlib import pyplot as plt
import matplotlib.dates as mdates
import pandas, geopandas, pyproj, datetime, numpy, rasterio
from tqdm import tqdm
from libs.RASTERHELPER import RASTERHELPER as RH
import tensorflow as tf
tf.config.optimizer.set_jit(False)
from tensorflow.keras import models

RH=RH()
STRIDE =8
N_EPOCH = 200
N_INPUTBANDS = 2
TARGET_SHAPE = (128, 128)
TARGET_SHAPE_X = (N_INPUTBANDS, 128, 128)
TARGET_SHAPE_Y = (128, 128)
TRAINING_BATCH_SIZE = 16
SEED = 50
MIN_R_H, MIN_R_W = 32, 32
PREDICTOR_NAMES = ["VV", "VH"]
PREDICTING_NAME = "NDVI"

ctypes_to_plot = {'3': 'Winter Wheat', '171': 'Maize Grain', '172': 'Maize Biogas', '411': 'Maize Silage'}
fields_to_plot = [32381, 12345]
min_vals = [-49.042988, -89.03331, 7.8717454e-07, 0.002476306]
max_vals = [43.408474, 20.598831, 7.9789853, 811394.9]
DIR_MODEL_SAVE = './../Models_S1S2/'
s1_archive_root = './../Data/FieldwiseSentinel1Archive'
DIR_PLOTS = "./Plots/FieldwisePlots"
MODEL_NAME = 'Unet_Model_2025-08-12_14-10.keras'
MODEL_HISTNAME = 'Unet_TrainingLog_2025-08-12_14-10.csv'
Load Images and Pre process, and feature engineering
print(f"\n\n{'='*40}\nLoading Sentinel 1 Arcive of the fields\n{'='*40}")
all_s1_files = glob(os.path.join(s1_archive_root, '**', '*.tif'), recursive=True)
s1_arch_fs = [file for file in all_s1_files if '_predicted' not in os.path.basename(file)]
print(f'\tCreating datframe from Sentinel 1 metadata')
s1_arch_fs_df = RH.create_dataframe_ts(s1_arch_fs)

top_fieldnum =  32381 # s1_arch_fs_df['FIELDNUM'].value_counts().idxmax() # 30579, 32381, 951
s1_arch_fs_df = s1_arch_fs_df[s1_arch_fs_df['FIELDNUM']== top_fieldnum].copy().reset_index()

top_field_s1_df = s1_arch_fs_df[s1_arch_fs_df['FIELDNUM']==top_fieldnum].reset_index(drop=True)
print(f'\tSelected Field: {top_fieldnum}, Count: {len(top_field_s1_df)}, Crop Types: {top_field_s1_df.CROPTYPE.unique()}')
top_field_s1_df['DATE'] = pandas.to_datetime(top_field_s1_df['DATE'])
top_field_s1_df['YEAR'] = top_field_s1_df['DATE'].dt.year
top_field_s1_df['DOY'] = top_field_s1_df['DATE'].dt.dayofyear
unique_years_crop_types = top_field_s1_df.groupby('YEAR')['CROPTYPE'].unique()
yearly_crop_df = pandas.DataFrame({'YEAR': unique_years_crop_types.index, 'CROPTYPE': unique_years_crop_types.values})

print(f"\n\n{'='*40}\nFiltering and Processing and Feature Engineering\n{'='*40}")
AllFilesDF = top_field_s1_df
AllFilesDF = AllFilesDF.copy()
results_all = AllFilesDF.apply(RH.check_row_for_errors_saronly_ts, axis=1, predictor_bands=PREDICTOR_NAMES, predicting_name=PREDICTING_NAME, nan_threshold=1, min_r_h=MIN_R_H, min_r_w=MIN_R_W, verbose=False)
AllFilesDF[['IS_VALID', 'ERROR_MESSAGE', 'META_INFO']] = pandas.DataFrame(results_all.tolist(), index=AllFilesDF.index)
updated_all_df = AllFilesDF[AllFilesDF['IS_VALID']].reset_index(drop=True)
all_error_files = AllFilesDF[~AllFilesDF['IS_VALID']]
print(f"\tFiltering All Done, Removed {len(all_error_files)} rows, Current Shape: {updated_all_df.shape}")

bands_all_predictor, all_processing_error = RH.processFiles_saronly_ts(dataframe=updated_all_df, predictor_names=PREDICTOR_NAMES, predicting_name=PREDICTING_NAME, filling_ksize = 1, plot_filling_comp = False, verbose = True)
print(f"\tFilling all Done, Errors: {len(all_processing_error)}")
updated_all_df = RH.remove_error_indices(updated_all_df, all_processing_error)
print(f"\tCleaned All size: {updated_all_df.shape}")
# Process all predictor images
print(f"\tAdding RVI and BCR band")
bands_all_predictor = RH.feature_generation_rvi_bcr(bands_all_predictor)
print(f"\tNormalizing Bands")
bands_all_predictor, min_vals, max_vals = RH.normalize_bands_minmax(bands_all_predictor, min_vals=min_vals, max_vals=max_vals)
print(f"\tAdding DOY band{'*'*10}")
bands_all_predictor = RH.addDoyBand(bands_all_predictor, updated_all_df)
print(f"\tExample normalized All image shape: {bands_all_predictor[0].shape}")
# RH.plot_distributions(updated_all_df, df_title = f'All(Total: {updated_all_df.shape}', plot_save_dir=None)
========================================
Loading Sentinel 1 Arcive of the fields
========================================
    Creating datframe from Sentinel 1 metadata
Processing files: 100%|███████████████████████████████████████████████████████████████████████████████████████████████████████████████| 1065/1065 [00:00<00:00, 5370.21it/s]
    Selected Field: 32381, Count: 534, Crop Types: [ 10   3 411]

========================================
Filtering and Processing and Feature Engineering
========================================
    Filtering All Done, Removed 16 rows, Current Shape: (518, 10)
    Filling all Done, Errors: 0
    Cleaned All size: (518, 10)
    Adding RVI and BCR band
    Normalizing Bands
    Adding DOY band**********
    Example normalized All image shape: (5, 132, 144)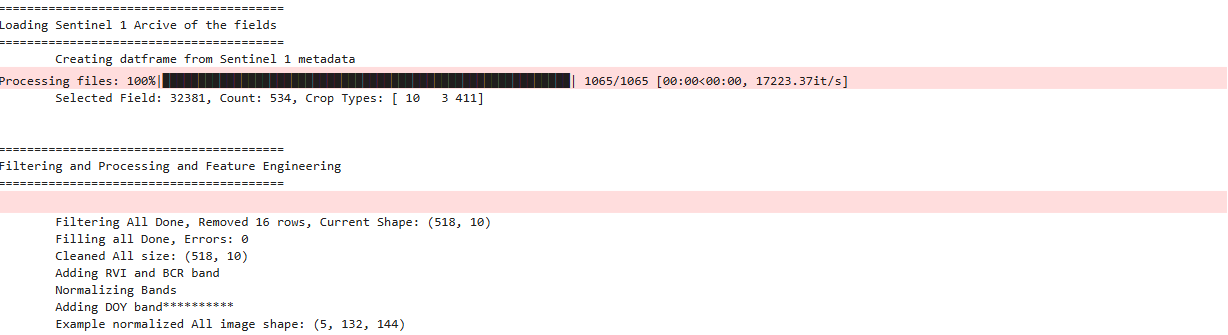
Creating the prediction for complete archive
print(f"\n\n{'='*40}\nLoading pretrained model\n{'='*40}")
patch_size = TARGET_SHAPE
model_file = f'{DIR_MODEL_SAVE}{MODEL_NAME}'
model = models.load_model(model_file)
print(f"\tModel loaded from {model_file}")

print(f"\n\n{'='*40}\nChipping Images\n{'='*40}")
reconstructed_predicted_images_paths = []
# Loop through each Sentinel-1 image provided
for i, image_x in enumerate(tqdm(bands_all_predictor, desc="Chipping and Preciting Images")):
    image_x_info = updated_all_df.loc[i]
    original_unpadded_shape_x = image_x.shape
    x_patches_with_coords = RH.extract_patches_overlapping(image_array=image_x, patch_size=patch_size, stride=(TARGET_SHAPE[0] - STRIDE, TARGET_SHAPE[0] - STRIDE), pad_mode='symmetric')
    if not x_patches_with_coords:
        print("\tNo patches extracted. Skipping...")
        continue
    x_all_patches = [patch[0] for patch in x_patches_with_coords]
    X_model_input = numpy.transpose(numpy.array(x_all_patches), (0, 2, 3, 1))
    predicted_patches_model_output = model.predict(X_model_input, verbose=0)
    predicted_patches_for_reconstruction = numpy.transpose(predicted_patches_model_output, (0, 3, 1, 2))
    # Prepare the (patch_data, coords) tuples for the reconstruction function
    predicted_patches_with_coords_for_reconstruction = [(predicted_patches_for_reconstruction[j], x_patches_with_coords[j][1]) for j in range(len(x_patches_with_coords))]
    last_y_coord = x_patches_with_coords[-1][1][0]
    last_x_coord = x_patches_with_coords[-1][1][1]
    padded_H = last_y_coord + patch_size[0]
    padded_W = last_x_coord + patch_size[1]
    reconstructed_pred_ndvi = RH.reconstruct_overlapping(predicted_patches_with_coords=predicted_patches_with_coords_for_reconstruction, original_padded_shape=(1, padded_H, padded_W),
        original_unpadded_shape=(1, original_unpadded_shape_x[1], original_unpadded_shape_x[2]), patch_size=TARGET_SHAPE)
    reconstructed_pred_ndvi_final = reconstructed_pred_ndvi.squeeze()
    image_x_meta = image_x_info.META_INFO

    # Project the image and write to file
    if isinstance(image_x_meta, dict):
        transform_from_meta =rasterio.transform.Affine(*image_x_meta['transform'])
        crs_from_meta = image_x_meta['crs']
        output_filename = image_x_info.FILEPATH.replace('.tif', '_predicted.tif')
        profile = { 'driver': 'GTiff', 'crs': crs_from_meta, 'transform': transform_from_meta, 'count': 1, 'dtype': reconstructed_pred_ndvi_final.dtype,
                   'height': reconstructed_pred_ndvi_final.shape[0], 'width': reconstructed_pred_ndvi_final.shape[1]
                  }
        data_to_write = reconstructed_pred_ndvi_final.reshape(1, profile['height'], profile['width'])
        with rasterio.open(output_filename, 'w', **profile) as dst:
            dst.write(data_to_write)
            reconstructed_predicted_images_paths.append(output_filename)
    else:
        print("\tMETA_INFO is not in the expected dictionary format. Cannot project the image.")

print(f"\tPrediction and reconstruction done of  {len(reconstructed_predicted_images_paths)} images")
========================================
Loading pretrained model
========================================
Model loaded from ./../Models_S1S2/Unet_Model_2025-08-12_14-10.keras
========================================
Chipping Images
========================================
Chipping and Preciting Images: 100%|██████████████████████████████████████████████████████████████████████████████████████████████████████| 518/518 [08:24<00:00, 1.03it/s]
Prediction and reconstruction done of 518 images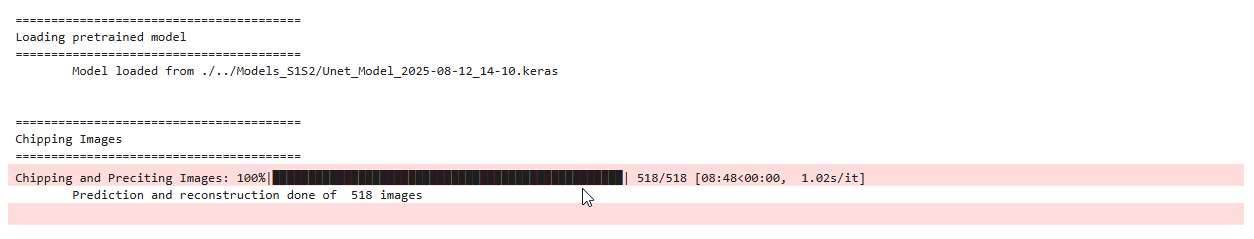
Existing S2 based NDVI(Groundtruth)
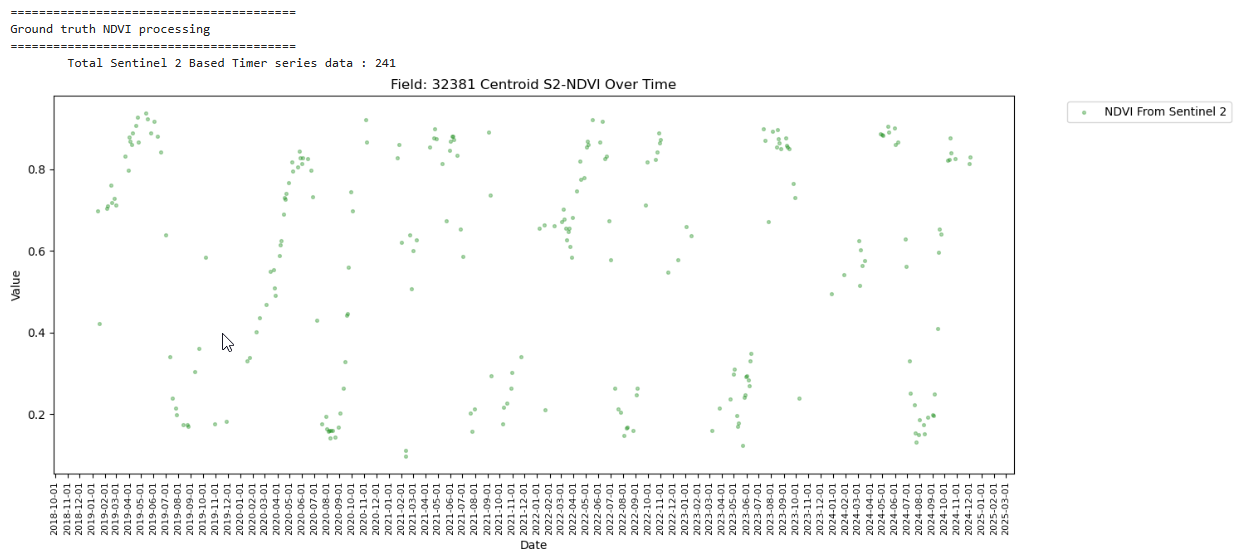
print(f"\n\n{'='*40}\nGround truth NDVI processing\n{'='*40}")
topfield_ndvi_ts_path = f'./../Data/FieldwiseNDVITimeseriesData/{top_fieldnum}'
topfield_ndvi_ts_fs = glob(os.path.join(topfield_ndvi_ts_path, '*.gpkg'))
if not topfield_ndvi_ts_fs:
    print("\tNo .gpkg files were found to read. Please check your path and file names.")
else:
    gdf_list = []
    for file_path in topfield_ndvi_ts_fs:
        gdf = geopandas.read_file(file_path)
        gdf_list.append(gdf)
    combined_gdf = geopandas.GeoDataFrame(pandas.concat(gdf_list, ignore_index=True))
print(f'\tTotal Sentinel 2 Based Timer series data : {len(combined_gdf)}')
combined_gdf['DATE'] = pandas.to_datetime(combined_gdf['time'])
combined_gdf['YEAR'] = combined_gdf['DATE'].dt.year
combined_gdf['DATE'] = combined_gdf['DATE'].dt.date
yearly_crop_df['CROPTYPE'] = yearly_crop_df['CROPTYPE'].str[0]
combined_gdf = combined_gdf.merge(yearly_crop_df, on='YEAR', how='left')
combined_gdf = combined_gdf.sort_values("DATE")
combined_gdf["crop_type_shift"] = (combined_gdf["CROPTYPE"] != combined_gdf["CROPTYPE"].shift()).cumsum()

plt.figure(figsize=(15, 6))
plt.scatter(combined_gdf["DATE"], combined_gdf["NDVI_at_Centroid"], label="NDVI From Sentinel 2", marker='.', color='green', s=30, alpha=0.3)
handles, labels = plt.gca().get_legend_handles_labels()
plt.xlabel("Date")
plt.ylabel("Value")
plt.title(f"Field: {top_fieldnum} Centroid S2-NDVI Over Time")
plt.legend(handles, labels, bbox_to_anchor=(1.05, 1), loc='upper left')
ax = plt.gca()
ax.xaxis.set_major_locator(mdates.MonthLocator(interval=1))
ax.xaxis.set_major_formatter(mdates.DateFormatter('%Y-%m-%d'))
plt.xticks(rotation=90, fontsize=8)
plt.tight_layout()
plt.show()
========================================
Ground truth NDVI processing
========================================
Total Sentinel 2 Based Timer series data : 241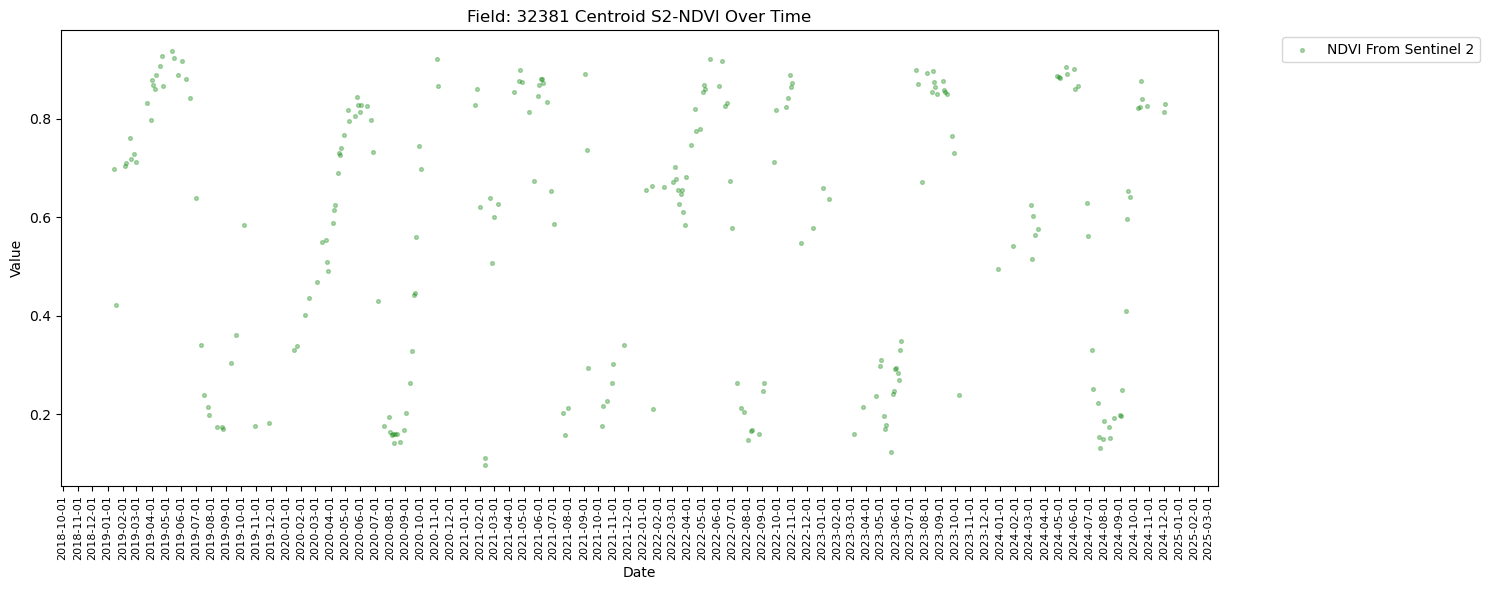
Denser timeseries
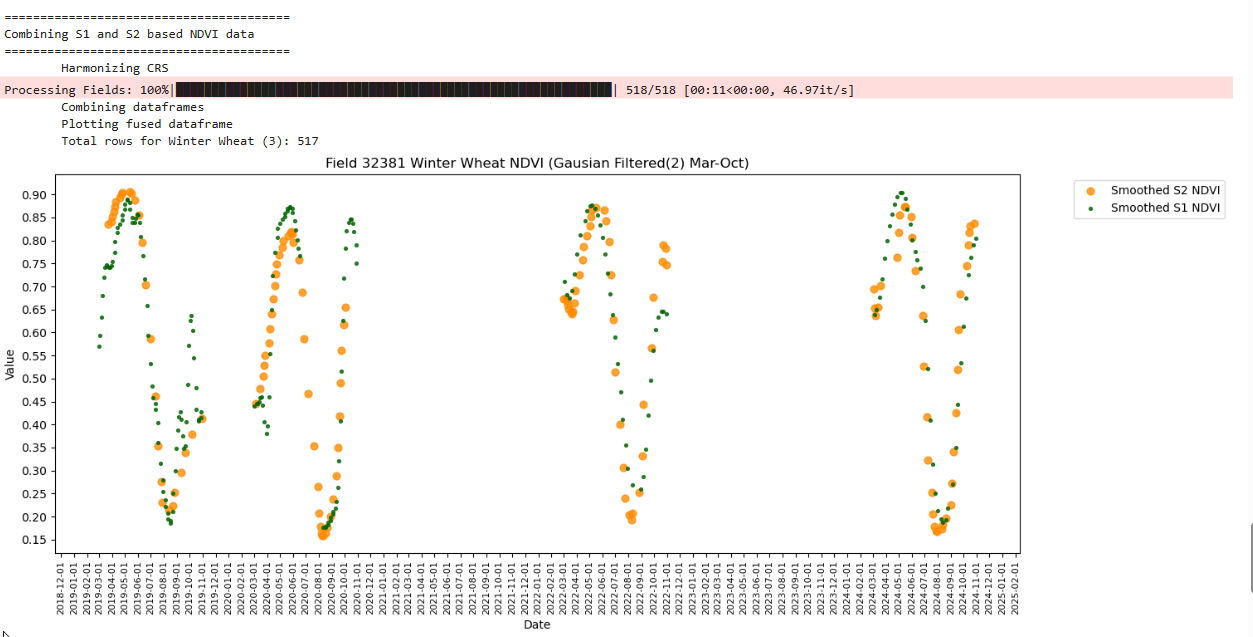
print(f"\n\n{'='*40}\nCombining S1 and S2 based NDVI data\n{'='*40}")
centroid_wgs84 = combined_gdf.geometry.unique()
if len(centroid_wgs84) > 0:
field_centroid_point = centroid_wgs84[0]
else:
field_centroid_point = None
centroid_crs_wgs84 = "EPSG:4326"
print(f'\tHarmonizing CRS')
for index, field_info in tqdm(updated_all_df.iterrows(), total=len(updated_all_df), desc="Processing Fields"):
prediction_filepath = field_info['FILEPATH'].replace('.tif', '_predicted.tif')
if not os.path.exists(prediction_filepath):
print(f"Predicted file not found for index {index}: {prediction_filepath}. Skipping.")
continue
if field_centroid_point:
with rasterio.open(prediction_filepath) as src:
raster_crs = src.crs
transformer = pyproj.Transformer.from_crs(centroid_crs_wgs84, raster_crs, always_xy=True)
reprojected_x, reprojected_y = transformer.transform(field_centroid_point.x, field_centroid_point.y)
reprojected_centroid_coords = (reprojected_x, reprojected_y)
updated_all_df.loc[index, 'longitude'] = field_centroid_point.x
updated_all_df.loc[index, 'latitude'] = field_centroid_point.y
updated_all_df.loc[index, 'geometry'] = field_centroid_point
try:
predicted_value = [val for val in src.sample([reprojected_centroid_coords])][0][0]
updated_all_df.loc[index, 'NDVI_at_Centroid'] = predicted_value
except IndexError:
updated_all_df.loc[index, 'NDVI_at_Centroid'] = None
print(f"\tCould not sample at centroid for {os.path.basename(prediction_filepath)}. Coordinates may be outside the image bounds.")
else:
print("\tCentroid point not found. Cannot find value at centroid.")
print(f'\tCombining dataframes')
combined_gdf['SOURCE'] = 'S2'
updated_all_df['SOURCE'] = 'S1'
common_columns = combined_gdf.columns.intersection(updated_all_df.columns)
updated_all_df = updated_all_df[common_columns]
combined_gdf = combined_gdf[common_columns]
final_df = pandas.concat([combined_gdf, updated_all_df], ignore_index=True)
smoothing_sigma = 2
original_final_df = final_df.copy()
print(f'\tPlotting fused dataframe')
for ctype, crop_name in ctypes_to_plot.items():
df_to_plot = original_final_df[original_final_df['CROPTYPE'] == int(ctype)].copy().reset_index()
if df_to_plot.empty:
print(f"No data found for crop type: {ctype} ({crop_name}). Skipping.")
continue # Skip to the next crop type
df_to_plot['DATE'] = pandas.to_datetime(df_to_plot['DATE'])
df_to_plot = df_to_plot.sort_values(by='DATE').reset_index(drop=True)
print(f"\tTotal rows for {crop_name} ({ctype}): {len(df_to_plot)}")
s1_data = df_to_plot[df_to_plot['SOURCE'] == 'S1']
s2_data = df_to_plot[df_to_plot['SOURCE'] == 'S2']
# Call plotting functions with the current, filtered DataFrame and crop name
# RH.plot_tscomp_ts(df_to_plot, 3, 10, s1_smooth=False, s2_smooth=False, smoothing_sigma = smoothing_sigma, title=f"Field {top_fieldnum} {crop_name} NDVI (Raw Mar-Oct)", save_path = f'{DIR_PLOTS}/FieldWiseTimeseriesPlots/{top_fieldnum}')
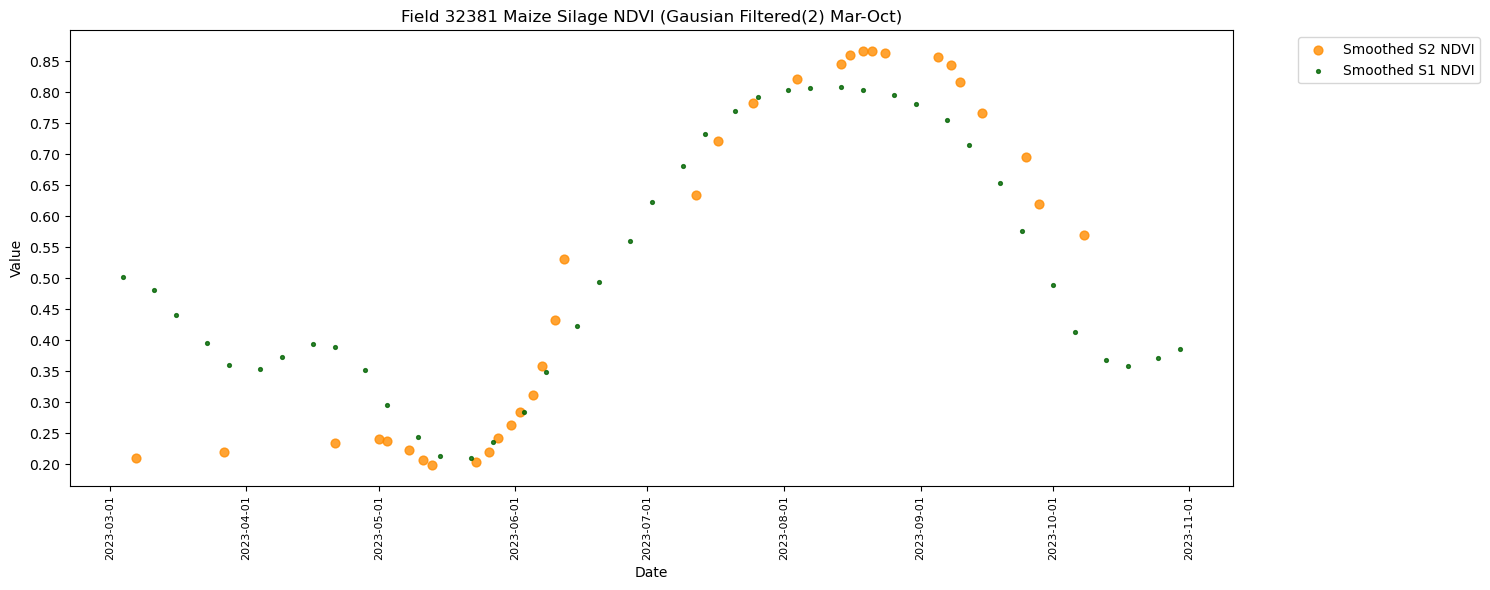
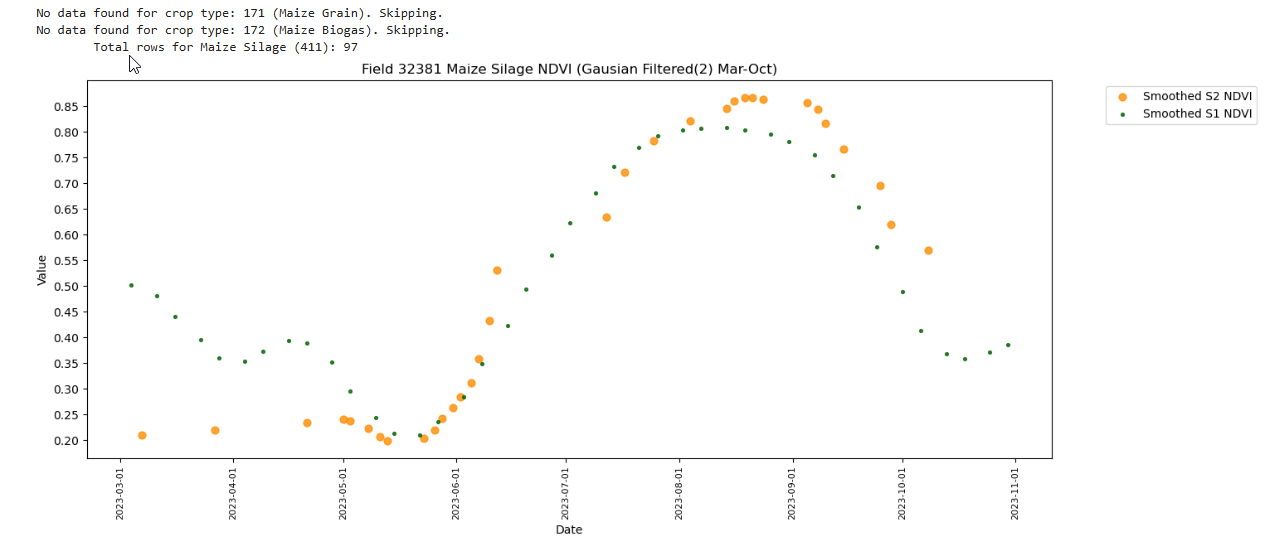
RH.plot_tscomp_ts(df_to_plot, 3, 10, s1_smooth=True, s2_smooth=True, smoothing_sigma = smoothing_sigma, title=f"Field {top_fieldnum} {crop_name} NDVI (Gausian Filtered({smoothing_sigma}) Mar-Oct)", save_path = f'{DIR_PLOTS}/FieldWiseTimeseriesPlots/{top_fieldnum}')
========================================
Combining S1 and S2 based NDVI data
========================================
    Harmonizing CRS
Processing Fields: 100%|██████████████████████████████████████████████████████████████████████████████████████████████████████████████████| 518/518 [00:05<00:00, 92.28it/s]
    Combining dataframes
    Plotting fused dataframe
    Total rows for Winter Wheat (3): 517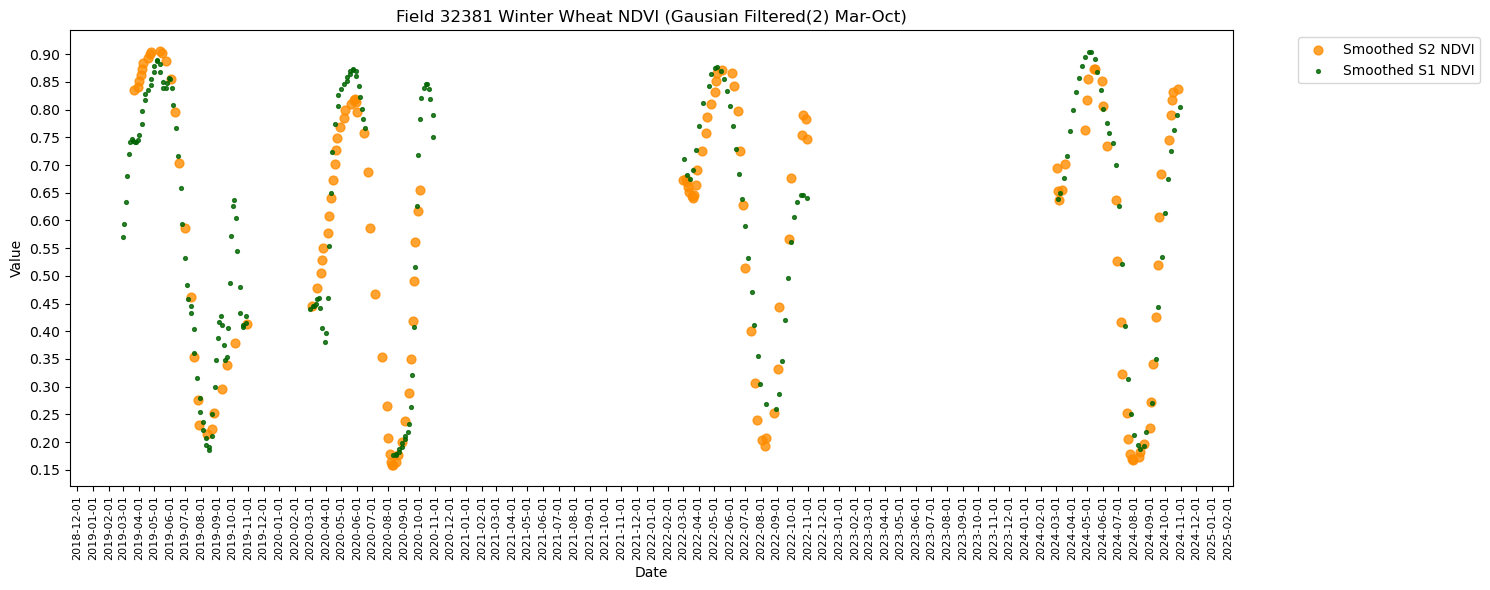
No data found for crop type: 171 (Maize Grain). Skipping.
No data found for crop type: 172 (Maize Biogas). Skipping.
    Total rows for Maize Silage (411): 97